At the end of every month, the medical records team puts together the inpatient report, and the same six abbreviations always show up: BOR, ALOS, TOI, BTO, GDR, and NDR. The numbers are discussed in management meetings, sent in the hospital's routine reporting, and compared with the previous month. But when one of them suddenly jumps, the first question is usually not "why did our care change?" but "where does this number come from?".
This article tries to answer that second question: what each indicator means, its formula, the ideal range commonly used, and how to read it.
Two terms that are easy to mix up
Before the formulas, two terms need to be told apart because different indicators use them:
- Inpatient days come from the daily census: how many patients are in a bed each day, added up over a period. A patient admitted and discharged on the same day counts as one day.
- Length of stay is counted per discharged patient: discharge date minus admission date. A same-day admission and discharge also counts as one day.
BOR and TOI use inpatient days. ALOS uses length of stay. This means a patient still in hospital at the end of the month already contributes to BOR, but only enters ALOS once they go home.
Six indicators, one by one
The ideal ranges below follow the Indonesian Ministry of Health standard (2005), which is still widely used in Indonesian hospitals. "Discharges" means patients discharged alive or dead.
BOR (Bed Occupancy Ratio)
How full the beds are.
- Formula: BOR = inpatient days ÷ (number of beds × days in the period) × 100%.
- Ideal: 60–85%.
ALOS (Average Length of Stay)
- Formula: ALOS = total length of stay of discharged patients ÷ number of discharges.
- Ideal: 6–9 days.
TOI (Turn Over Interval)
The average time a bed stays empty between two patients.
- Formula: TOI = ((number of beds × days) − inpatient days) ÷ number of discharges.
- Ideal: 1–3 days.
BTO (Bed Turn Over)
How many times one bed is used.
- Formula: BTO = number of discharges ÷ number of beds.
- Ideal: 40–50 times a year, or roughly 3.3–4.2 times a month.
GDR (Gross Death Rate)
- Formula: GDR = number of deaths ÷ number of discharges × 1,000.
- Ideal: no more than 45 per 1,000 discharges (45‰).
NDR (Net Death Rate)
Deaths after 48 hours or more in hospital.
- Formula: NDR = deaths after ≥ 48 hours of care ÷ number of discharges × 1,000.
- Ideal: no more than 25‰.
NDR deliberately counts only deaths after 48 hours, because deaths in the first two days are driven more by the patient's condition on arrival than by the care they received in hospital.
A worked example
Suppose a fictional hospital has 100 beds. In one month (30 days) it records:
- inpatient days: 2,250,
- discharges: 400 patients, with a total length of stay of 2,200 days,
- deaths: 12 patients, 6 of them after 48 hours or more in hospital.
Then:
- BOR = 2,250 ÷ (100 × 30) × 100% = 75%
- ALOS = 2,200 ÷ 400 = 5.5 days
- TOI = ((100 × 30) − 2,250) ÷ 400 = 750 ÷ 400 ≈ 1.9 days
- BTO = 400 ÷ 100 = 4 times in the month
- GDR = 12 ÷ 400 × 1,000 = 30‰
- NDR = 6 ÷ 400 × 1,000 = 15‰
Five indicators fall within the ideal range. ALOS is slightly below 6 days — and that is not necessarily bad news. Patients may simply be recovering faster, or the hospital may handle many cases that are short by nature, such as normal deliveries or day procedures.
Read them together, not one at a time
A single indicator rarely says much on its own. Some patterns that come up often:
- High BOR with a very low TOI means beds are almost never empty. New patients may wait a long time in the emergency department, and there is little time to clean and prepare beds.
- Low BOR with a high TOI means many beds sit idle. That can point to excess capacity — or to bed data that has not been updated.
- Long ALOS with low BTO can reflect genuinely complex cases, but it can also mean discharges are getting stuck, for example while waiting for test results or paperwork.
- GDR and NDR need to be read alongside the case mix. A referral hospital that receives the most critical patients will reasonably have a higher death rate than one that does not take such cases.
An ideal range is a reference point, not a report card. A number outside the range is a reason to ask questions, not a conclusion.
When the numbers are off because of the data
In our experience, a jump in an indicator more often comes from record-keeping than from a change in care. The most common causes:
- The patient has gone home but has not been discharged in the system. Inpatient days keep adding up, so BOR rises and TOI falls. When the discharge is finally recorded, the length of stay is inflated and ALOS jumps.
- The bed count is not updated. A ward closed temporarily, or extra beds that were never registered, immediately change BOR, TOI, and BTO.
- Admission or death times are incomplete. Without accurate times, deaths before and after 48 hours cannot be separated, so NDR cannot be calculated correctly.
- A ward transfer is recorded as a discharge and a new admission. Discharges are artificially inflated, making ALOS look shorter and BTO higher.
So before discussing why an indicator changed, it is worth making sure the data behind it is right.
In HISGrace SIMRS
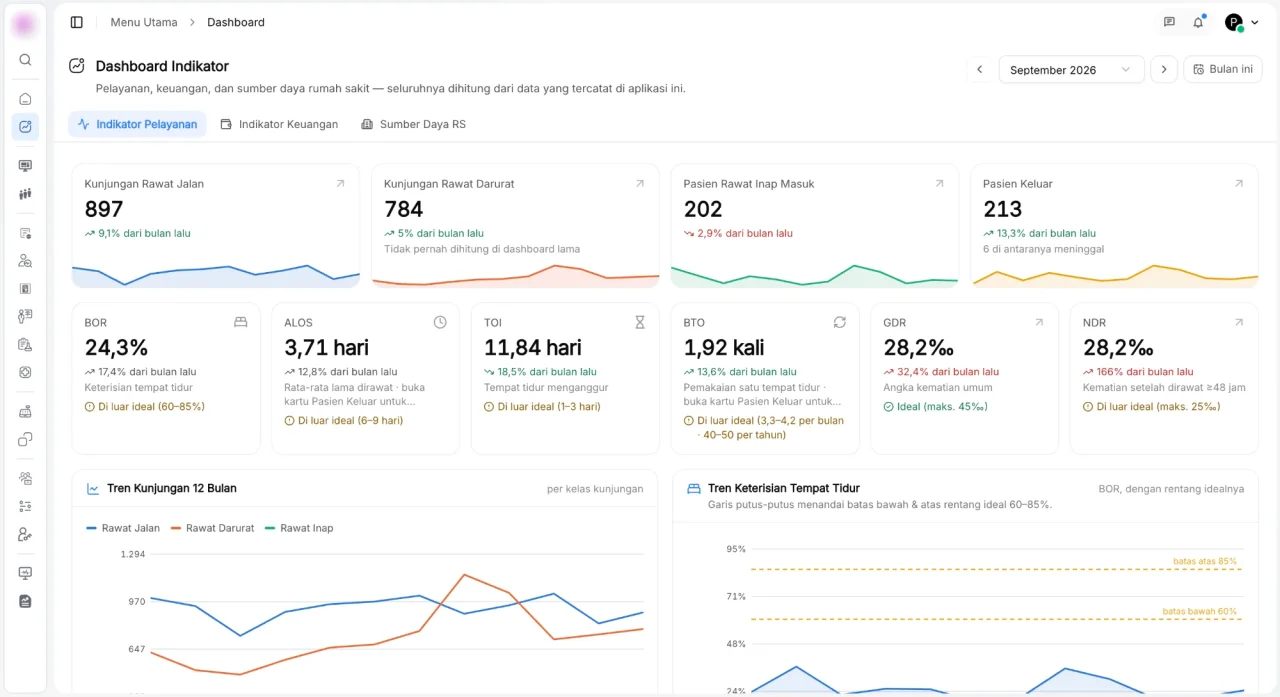
In HISGrace SIMRS, all six indicators are calculated directly from the admission, room transfer, and discharge data that staff record every day. Each number is shown with a comparison to the previous month and its ideal range, so anything out of line is visible without recalculating in a spreadsheet.
 Each indicator is shown alongside its ideal range (Indonesian interface).